
India IIP September 2026: 6.7% Growth Explained for UPSC
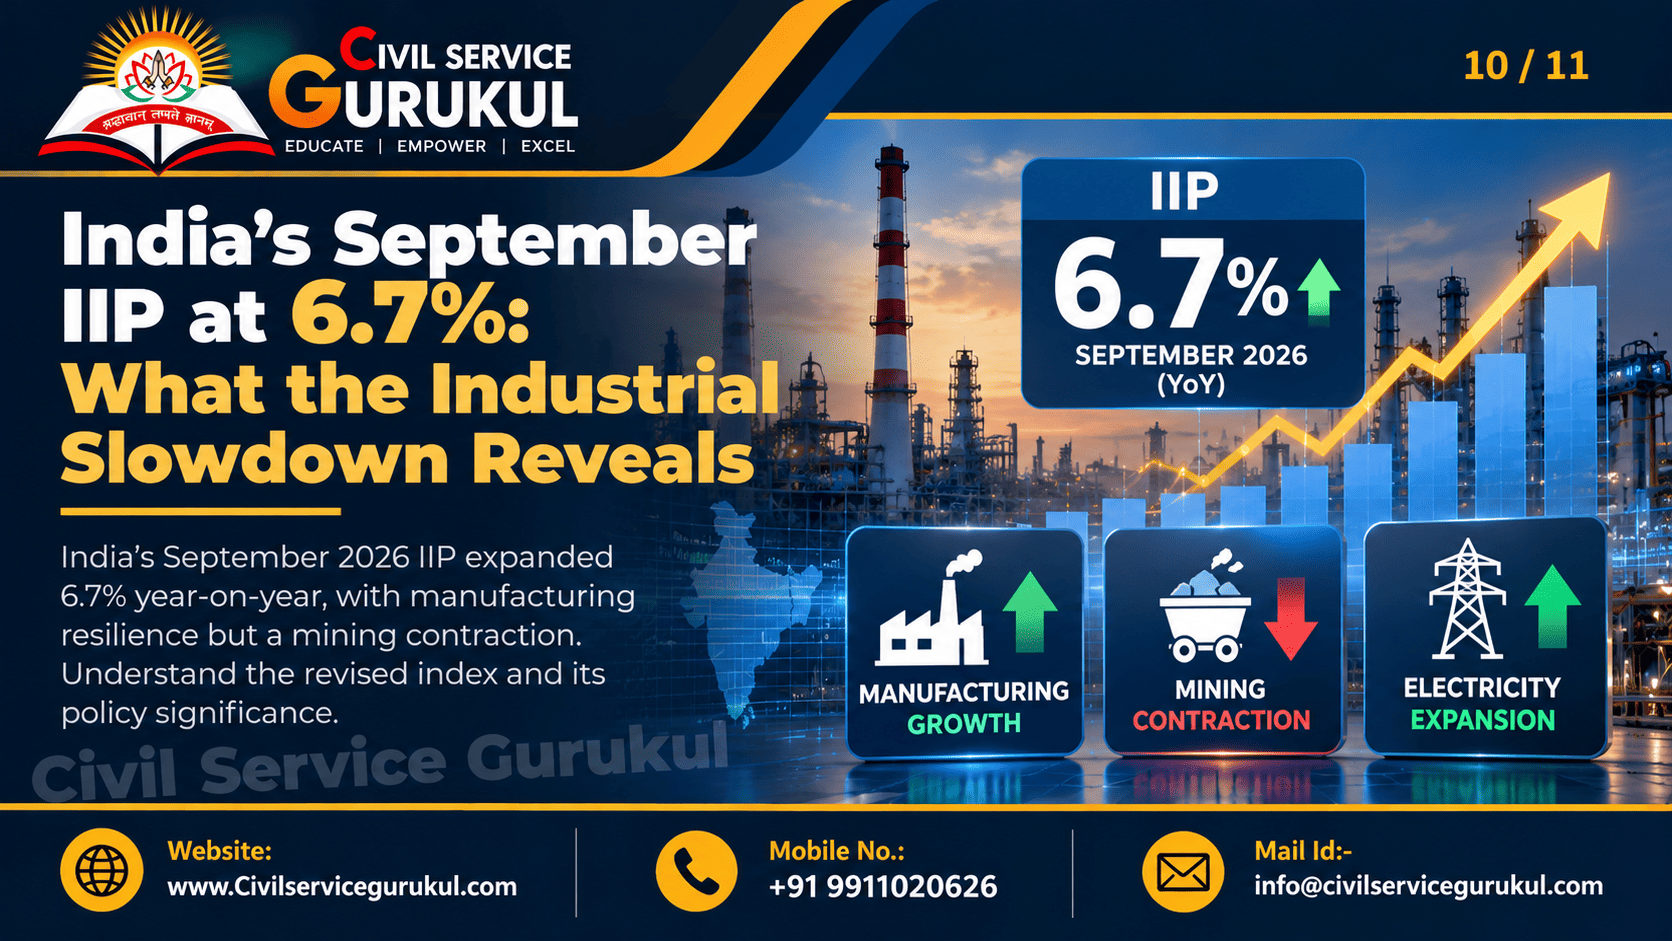
India's Industrial Growth at 6.7% in September 2026: Why Manufacturing Strength Masks an Uneven Recovery
A comprehensive examination of industrial production, manufacturing, mining, investment demand and economic policy implications.
India's Index of Industrial Production reportedly registered 6.7% year-on-year growth in September 2026, compared with a revised 7.8% in August. Manufacturing and electricity showed strong performance, while mining contracted. The contrasting trends reveal why policymakers must examine sectoral composition rather than relying solely on headline growth.
GS Paper III: Indian Economy, industrial growth, infrastructure, investment, employment and inclusive development.
Prelims: Index of Industrial Production, National Statistical Office, base year, sectoral indices and economic indicators.
Why Is India's Industrial Growth in the News?
According to the supplied September 2026 IIP report, the Ministry of Statistics and Programme Implementation released industrial production quick estimates on 28 October 2026.
Industrial output expanded by 6.7% compared with September of the previous year, moderating from the revised 7.8% growth recorded in August 2026.
The moderation raises questions about the breadth and sustainability of industrial growth, particularly when manufacturing expansion coexists with contraction in mining.
A decline in the growth rate from 7.8% to 6.7% does not mean that industrial production declined. It means output continued to grow year-on-year, but at a slower pace.
What Is the Index of Industrial Production?
The Index of Industrial Production, commonly known as IIP, measures changes in the volume of industrial output over time.
It is a key short-term indicator used to assess trends in industrial activity and understand changes across major production sectors.
Who Compiles and Releases IIP?
The National Statistical Office, under the Ministry of Statistics and Programme Implementation, compiles and releases the national IIP.
Revised Base Year
The supplied report identifies 2022–23 = 100 as the revised base year for the IIP series.
The revised framework described in the source includes manufacturing, mining and quarrying, electricity and gas supply, and water supply, sewerage and waste management. Manufacturing carries the largest weight.
The base year provides a reference against which changes in production are measured. Revisions aim to improve the index's relevance to the evolving industrial structure.
September 2026 IIP: Sector-Wise Performance
The September data reveal substantial differences across industrial activities.
| Industrial Sector | Reported Growth | Interpretation |
|---|---|---|
| Overall IIP | 6.7% | Positive but slower growth |
| Manufacturing | 7.6% | Major support to industrial activity |
| Electricity and Gas Supply | 11.2% | Strong expansion |
| Water and Related Services | 5.8% | Moderate expansion |
| Mining and Quarrying | -6.2% | Contraction in output |
The general index reportedly reached 124.3, compared with 116.5 in September of the previous year.
These figures are described as quick estimates and may be revised when additional production data become available.
Manufacturing: The Main Driver of Industrial Growth
Manufacturing expanded by 7.6% in September 2026 according to the supplied report.
Of the 23 manufacturing groups, 17 reportedly registered positive growth.
Industries Showing Strong Growth
| Manufacturing Industry | Reported Growth |
|---|---|
| Electrical Equipment | 33.9% |
| Rubber and Plastic Products | 19.9% |
| Motor Vehicles | 19.0% |
The performance of these industries may reflect demand for equipment, transport products and intermediate manufactured goods.
However, strong growth in selected industries should not automatically be interpreted as uniform expansion across the entire manufacturing sector.
What Do Capital Goods and Consumer Goods Reveal?
Industrial production can also be examined according to the intended use of manufactured products.
Capital Goods
Capital goods output reportedly increased by 10.4%.
Capital goods include machinery and equipment used in further production. Their growth can indicate stronger investment-related industrial activity.
Consumer Non-Durables
Consumer non-durables reportedly grew by only 1.4%.
These are goods generally consumed over a relatively short period, such as various everyday consumption products.
The difference between 10.4% growth in capital goods and 1.4% growth in consumer non-durables suggests an uneven industrial pattern. However, IIP data alone cannot establish the complete condition of household consumption or private investment.
Economic and Policy Implications
Investment and Infrastructure
Growth in capital goods and electrical equipment may be consistent with stronger demand from machinery, infrastructure and industrial investment.
Employment Generation
Industrial growth can support employment, but output growth does not automatically translate into proportional job creation.
Labour-intensive and capital-intensive industries must therefore be examined separately.
Mining and Supply Chains
A contraction in mining output can affect the availability of industrial raw materials.
Weather disruptions, regulatory developments, base effects and operational constraints may also influence monthly mining data.
Fiscal and Monetary Analysis
Industrial activity influences tax collections, credit demand, transport requirements and business investment.
However, a single month's IIP release should not be treated as a complete measure of economic conditions.
Challenges in Interpreting IIP Data
- Monthly growth can be affected by the statistical base effect.
- Quick estimates may be revised as additional information arrives.
- Sector-wise growth can differ substantially from the headline index.
- Production volume does not directly measure profitability or employment.
- IIP and GDP measure different aspects of economic activity.
- Comparisons across different base-year series require care.
For meaningful economic analysis, IIP should be studied alongside GDP, GVA, employment indicators, investment trends, inflation and consumption data.
Way Forward: Strengthening India's Industrial Growth
- Improve industrial logistics and supply-chain reliability.
- Strengthen power availability for manufacturing enterprises.
- Support productivity improvements among micro, small and medium enterprises.
- Encourage technology adoption and workforce skill development.
- Monitor employment-intensive industries separately.
- Assess mining-sector bottlenecks and raw-material supply risks.
- Use multi-month trends and revised data before drawing major policy conclusions.
India's industrial strategy should focus not only on increasing aggregate output, but also on productivity, employment, resilience and balanced sectoral development.
UPSC Prelims Practice MCQs
Question 1
Which institution releases India's national Index of Industrial Production?
(a) Reserve Bank of India
(b) Ministry of Statistics and Programme Implementation
(c) NITI Aayog
(d) Securities and Exchange Board of India
The National Statistical Office, under the Ministry of Statistics and Programme Implementation, releases national IIP estimates.
Question 2
If the annual IIP growth rate declines from 7.8% to 6.7%, which conclusion is necessarily correct?
(a) Industrial production has contracted.
(b) Industrial production is growing at a slower annual rate.
(c) Industrial employment has declined.
(d) Manufacturing output has become negative.
Both growth rates are positive. The lower rate indicates slower year-on-year expansion, not necessarily an absolute decline in industrial output.
Question 3
Consider the following statements:
- IIP primarily measures changes in industrial production volume.
- IIP growth and GDP growth are identical indicators.
- Capital goods production can provide information about investment-related industrial activity.
Which of the statements given above are correct?
(a) 1 and 2 only
(b) 2 and 3 only
(c) 1 and 3 only
(d) 1, 2 and 3
Statements 1 and 3 are correct. IIP is a production-volume index, whereas GDP measures the value of final goods and services produced in an economy. The two indicators are not identical.
UPSC Mains GS Paper III: Answer Writing
Question: What does the sectoral composition of India's September 2026 industrial production reveal about the quality and sustainability of industrial growth? (250 words)
Suggested Answer Framework
Introduction: Mention the reported 6.7% industrial growth and explain why the composition of IIP matters.
Body: Analyse manufacturing growth, electricity expansion, mining contraction, capital goods performance and weaker consumer non-durables.
Critical Analysis: Discuss employment, investment, supply chains and the limitations of monthly quick estimates.
Way Forward: Recommend productivity growth, MSME competitiveness, infrastructure improvements and balanced industrial development.
Conclusion: Sustainable industrial development requires broad-based growth supported by productivity, employment and reliable economic infrastructure.
Frequently Asked Questions
What is IIP in the Indian economy?
The Index of Industrial Production measures changes in the volume of industrial output over time.
What was India's reported IIP growth in September 2026?
The supplied report states that industrial production grew 6.7% year-on-year.
Which sector contracted in September 2026?
Mining and quarrying reportedly contracted by 6.2%.
Why is manufacturing important in IIP?
Manufacturing has the largest weight in the revised IIP framework described in the supplied report.
What is the difference between IIP and GDP?
IIP measures industrial production volume, while GDP measures the monetary value of final goods and services produced in an economy.
Why are IIP estimates revised?
Initial quick estimates may be updated when more complete production information becomes available.
Civil Service Gurukul: Key Takeaway
India's reported September 2026 IIP performance demonstrates why headline industrial growth must be examined alongside sectoral trends. Strong manufacturing and capital goods production coexisted with mining contraction and modest consumer non-durables growth. For UPSC, the central lesson is to distinguish aggregate expansion from balanced and sustainable industrial development.
Important SEO Topics and Keywords
Prepare for UPSC with Civil Service Gurukul
Strengthen your preparation through syllabus-oriented current affairs, conceptual explanations, Prelims practice and Mains answer-writing guidance.
Website: www.civilservicegurukul.com
Mobile: +91 9911020626
Email: info@civilservicegurukul.com
Editorial Note: This original educational analysis is based on the uploaded September 2026 IIP report. The reported statistics have not been independently reconciled with the official statistical release. Practice questions are original educational material and not official UPSC examination questions.
Prepare with Mentors Who Cleared the Exam
Get personalized study plans, evaluated answer models, and test series access.